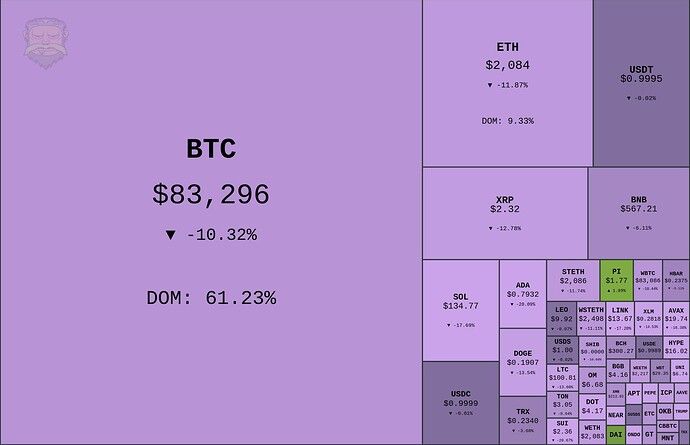
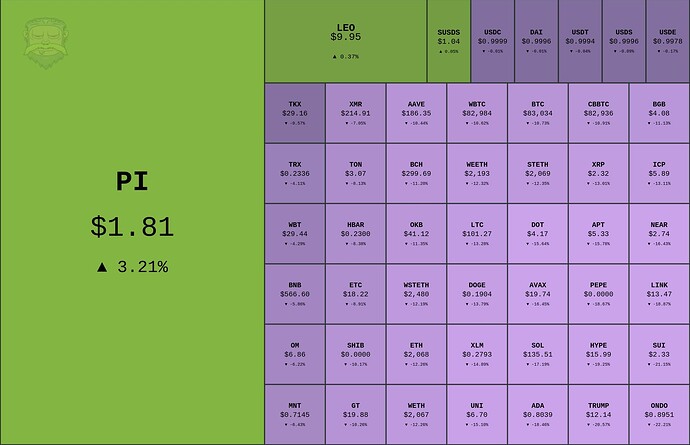
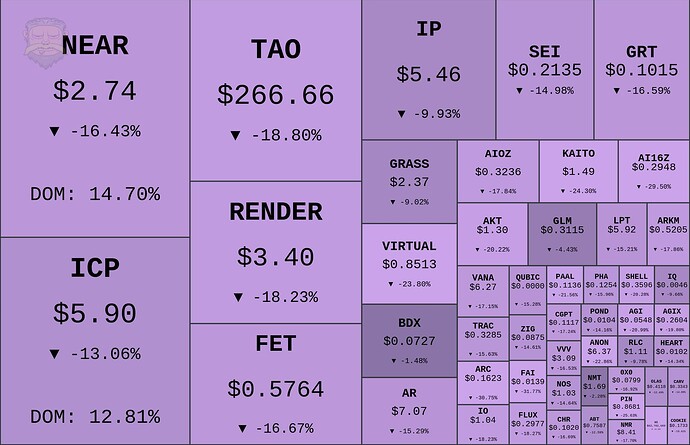
The hmap command allows you to create crypto heatmaps, providing a visual overview of market trends in crypto. By default, every box is scaled by market cap; they tell you how big of a share assets have within the top 50. The colors indicate the change in value, where more vibrant colors indicate bigger changes.
This is particularly useful for quickly spotting price movements and identifying hot and cold assets, helping you make informed decisions based on real-time data.
Commands
There are 3 commands: hmap (short: hm), and hmc.
/hm- heatmap by mcap/hmc- heatmap overview for popular categories
Example usage
Default count is 50. You can specify any value between 10-250. You can specify any category filter as known from the Index command.
/hm 30d vol- heatmap by 30d volume/hm 25 ai- heatmap by mcap, for top 25 AI coins/hm best sol 7d- SOL memes by 7d gain
/hm worst 10 rwaworst performing RWA tokens (from top 10)
[!example] Valid timeframes:
1h,24h,7d,1w,14d,2w,30d,1m,200d,1y
[!note] On mcap based queries, dominance (DOM) is calculated based on the tokens included in the grid. For total BTC dominance, run
/index.


